Backtest a paper portfolio, compare financial assets
Finamax brings together two free tools built on real prices: a portfolio simulator that goes back to any date you choose, and a tool that puts assets side by side on an animated chart.
No ads, no sign-up to compare, and no banking details: you are never asked for access to your accounts.
Build a paper portfolio and backtest it
Give it an amount, a starting date — twenty or thirty years back if you like — and an allocation. Finamax replays the real price history and shows what that portfolio would be worth today: estimated value, gross gain, performance and annual return.
- Day-by-day portfolio tracking.
- Recurring contributions, buys, sells, deposits and withdrawals: everything that happened since can be entered.
- Monthly, quarterly or yearly rebalancing — or none at all, and the weights drift on their own.
- Stocks, ETFs, indices, cryptocurrencies, precious metals, regulated savings accounts and currencies.
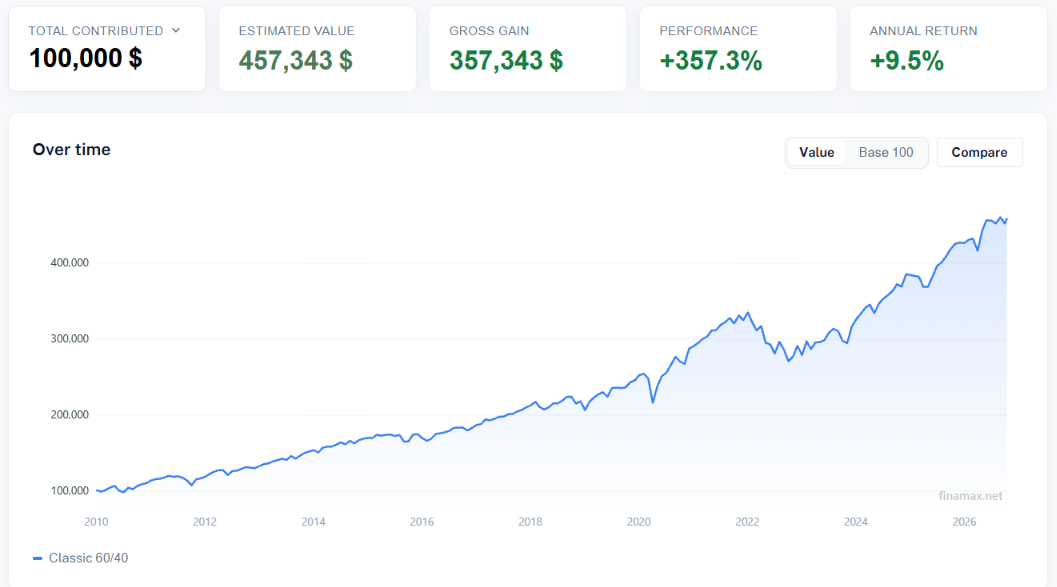
Check how your portfolios move, day after day
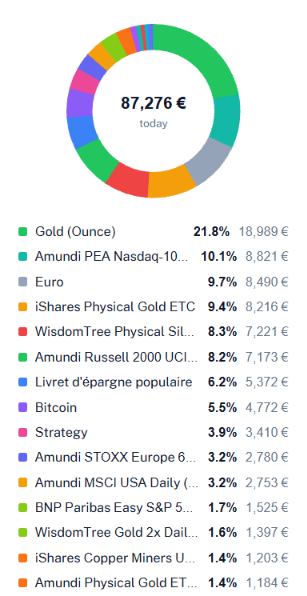
A portfolio’s page shows its value over time, its allocation line by line — today’s and the starting one, side by side —, the timeline of its movements, and a comparison against another portfolio or an asset.
The leaderboard of published portfolios
The portfolios their authors have made public, ranked on performance, annual return or maximum drawdown, and filterable by age. Publishing yours is optional, and reversible.
See the leaderboardCompare assets on an animated chart
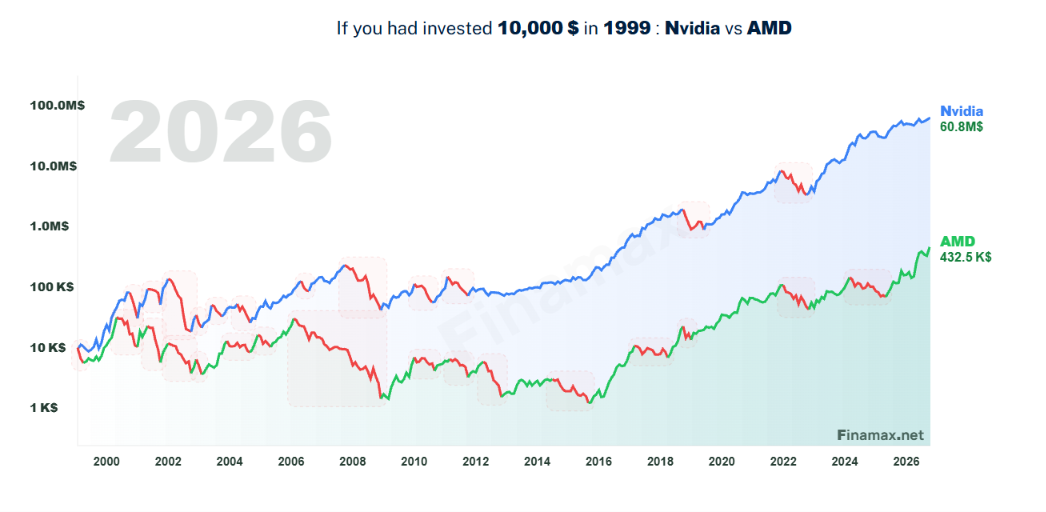
“If I had invested €10,000 in 1999…”: pick two or three assets and a period, then watch the curves draw themselves. Logarithmic scale, daily or monthly prices, optional monthly contribution.
There is also
Strategy analysis and backtests
Investment rules repeated everywhere, applied as they stand to decades of real prices and compared with the one strategy that takes even less work: doing nothing.
Four free calculators
Compound interest, mortgage, leverage and order book. No account required.
All matchups
Seventy-five asset duels, each with its figures: total and annualised performance, volatility and maximum drawdown.
Frequently asked questions
- What is a paper portfolio?
- A portfolio built on paper, with money that does not exist. You describe what you would have bought and when; Finamax values it with real prices. Nothing is bought, nothing is sold, and no banking details are ever requested.
- What is a portfolio backtest?
- Replaying a strategy over the past to see what it would have done. Here it only takes an old starting date: the portfolio is valued session after session from that date up to today. Past performance is no guide to future performance.
- Do I need an account?
- To compare assets, read the analyses and use the calculators: no. To save a portfolio and find it again on your next visit: yes, and it is free.
- Where do the prices come from?
- From the exchanges, through market data providers, refreshed every trading day. Regulated savings accounts follow their official rates.
- Is this investment advice?
- No. Finamax shows what past prices did, nothing more. The site gives no investment advice and recommends no asset.
Start with a date and an amount
The rest takes a few minutes to fill in.